One request, all the memory on the server, and a line of code that worked fine for years
Early one morning I got an alert that one of our production servers had become unhealthy.
On paper we had done everything right. Managed database, managed Redis for caching, a load balancer in front, auto scaling, health checks, alarms. The kind of setup where you think "ok, the cloud is handling the hard parts now".
It didn't matter. The server was down, and the reason was one request.
What happened
journalctl showed the web server had failed with result oom-kill, and dmesg had the rest of the story. The kernel's OOM killer had killed a process that was using almost all the memory on the machine.
Once the web server was gone it stopped answering the load balancer health checks, so the load balancer marked the server unhealthy and stopped sending traffic to it. I restarted the services and things went back to normal.
That was the easy part. The real question was, what was using all that memory?
Finding the request
The app logs around that time were full of errors from requests that died halfway. So I went to the access log and found a single request to a report endpoint that ran for minutes and returned a 500. Then I matched the PID of the process handling that request with the PID the kernel killed. Same process.
To be sure, I ran the same code on a dev environment and watched the memory climb until the dev server got stuck. So that was it, one request was enough to take a production server down.
The line
The code behind that report was doing something like this (simplified, not the real code):
rows = db.query("""
    SELECT * FROM orders
    JOIN ...                -- plus all the related records
    WHERE customer_id = :customer_id
""")                        # no date filter

cache.set(cache_key, list(rows))

return paginate(rows, page)
It looks normal. Load the records, cache them so the next page is fast, return the page the user asked for. It passed code review, it passed tests, and it worked fine for years.
The problem is list(rows). In a lot of frameworks a query result is lazy, it doesn't load anything until you actually use it. Calling list() on it forces it to load every row. So to put the result in the cache, the code loaded every record with every related record, with no date limit, into memory. Just to show the user the first page.
When that code was written it was a small number of rows. Years later it wasn't. The code didn't change, the data did, and one day it stopped fitting.
Why Redis didn't help
This is the part I want to stress. We had Redis, a managed one, but Redis never even came into it. The memory blew up inside the application process while it was building that list, before anything was sent to Redis.
Managed services protect you from their failures. The managed database looks after the database server, managed Redis looks after the cache server, the load balancer takes a dead server out. None of them can stop your own code from loading everything into memory. Actually the load balancer did exactly its job here, it saw an unhealthy server and stopped sending traffic to it. The problem was ours.
The fix
The fix itself was not complicated:
- Stop caching the whole result. Cache one page if you have to, never everything.
- Paginate in the database with
LIMITandOFFSET, so you only load the rows you show. - Only select the columns you need. Big text columns that the screen never shows don't belong in the query.
- Default to a time window. If the user didn't search for something specific, show something like the last year instead of everything since day one.
Would a load test have caught it?
This is the question I kept asking myself. My first answer was yes, but it's not that simple.
A normal load test sends a lot of requests and measures how fast they come back. But this outage wasn't about traffic, it was one request. If you run a load test against a dev database with a few thousand rows, this endpoint looks perfectly fine.
So I tested it. I asked an AI agent to build a small copy of the problem:
- a toy app with MySQL and Redis in Docker
- the app limited to 2 GB of memory with no swap
- two versions of the same endpoint, the bad one and the fixed one
- a script to seed millions of rows
- a script to measure the memory of each request
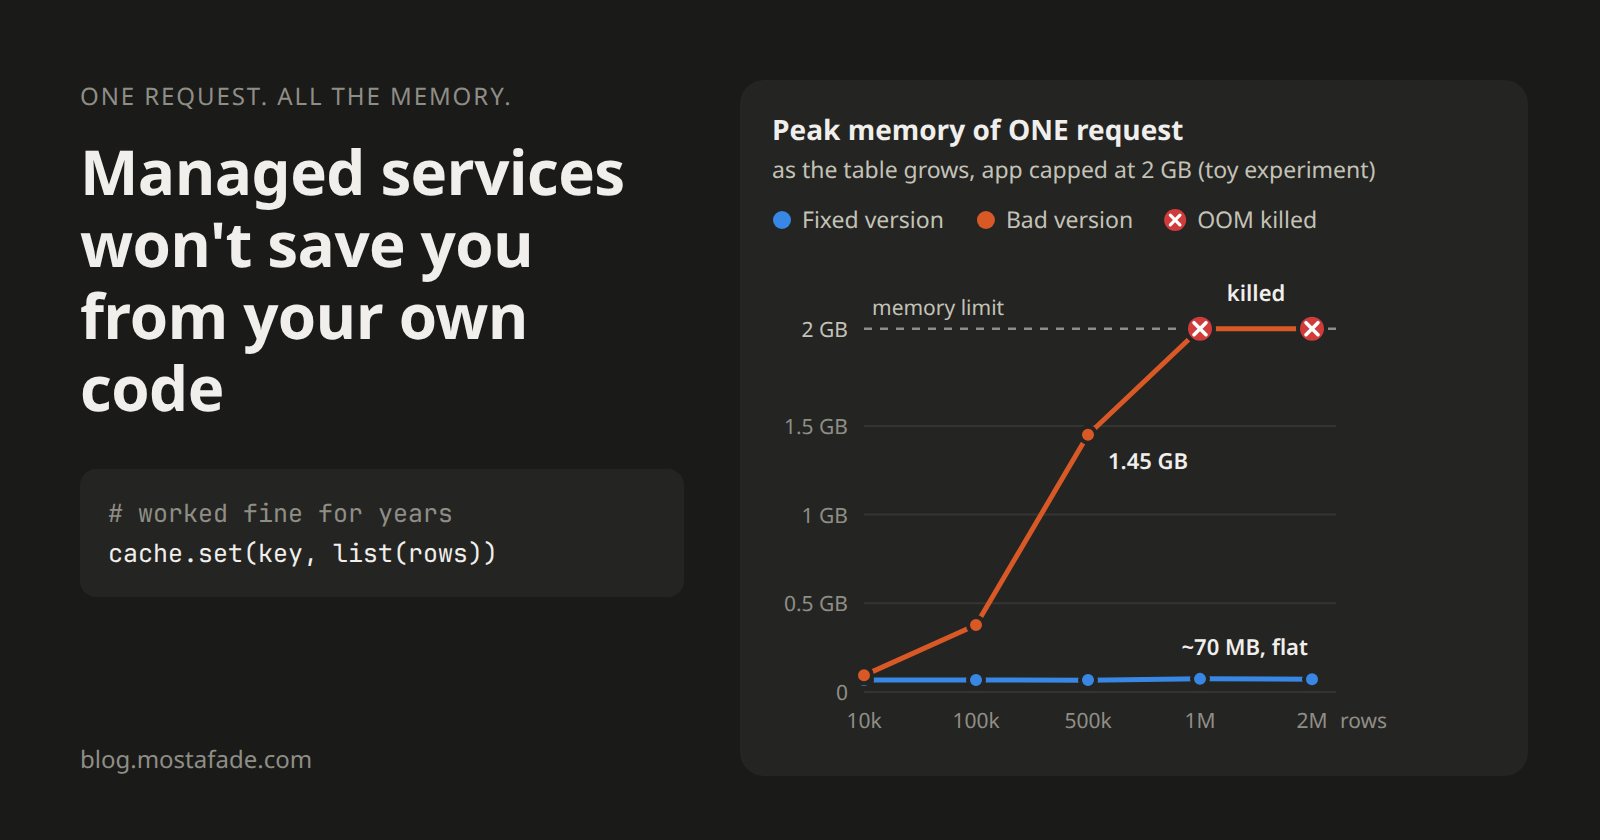
Here's what one request did to each version:
| Rows in the table | Bad version | Fixed version |
|---|---|---|
| 10k | 94 MB | 68 MB |
| 100k | 378 MB | 68 MB |
| 500k | 1.45 GB | 67 MB |
| 1M | killed (out of memory) | 74 MB |
| 2M | killed (out of memory) | 72 MB |
The fixed version stays flat no matter how much data there is. The bad one grows with the table until the kernel kills it.
Then I ran a normal load test against the bad endpoint using k6, a free load testing tool from Grafana where you write a small script and it simulates many users hitting your app at the same time. 20 virtual users for 30 seconds. On 10k rows it passed, 0% errors and p95 around 1.2 seconds. That's the green result a team would see if they only test on dev data. On 100k rows it already failed, and on 500k the workers got killed 10 times in 30 seconds.
Two things surprised me.
The data is small, the objects are not. At 500k rows the value written to Redis was about 300 MB. But the app used about 1.4 GB of memory to build it. Each row was around 1.5 KB once serialized, but around 7 KB as a Python object in memory. So "it's only a few hundred MB of data" can easily mean a few GB in your process.
Whether it takes the whole server down depends on your setup. In my test the health check never failed during a single bad request. The app server (gunicorn) had a second worker that kept answering, and it started a new worker after the first one was killed. In the real outage the whole web server went down with the process until it was restarted. Same bug, very different result.
This is where agents actually help
All of the test setup above, Docker, the seed script, the k6 test and the measuring script, took an AI agent about 38 minutes to build and run, twice. I still had to check the code and the numbers, but I didn't have to write it.
Before, this kind of test was always on the "we should do this one day" list. Seeding millions of realistic rows and building a proper harness was real work, and nobody had time for it. Now it's something you can ask for while you're having your coffee.
And it matters more now, because a lot more code is written by agents too. CodeRabbit looked at 470 open source pull requests and found that excessive I/O operations were about 8 times more common in AI-authored PRs (their report). To be clear, the code that took us down was written by a human, long before agents were writing code. But if agents make it faster to write code like this, they also make it cheap to test it properly. There's no excuse to skip that part anymore.
We're not the only ones either. PostHog had almost the same bug in February 2026, a cache task that loaded all of one account's data into memory and got OOM-killed. Their postmortem is worth reading.
What I'd do now
- Test every endpoint that lists or reports on data with production-sized data, or bigger. 10x what you have today is a good start, because that's where you'll be in a few years.
- Watch memory per process during the test, not just latency and error rate.
- Never cache something that has no limit on its size.
- Put a default limit on every query a user can trigger. A date window, a max number of rows, something.
- Make sure one runaway request can only kill itself, not the whole service. Request timeouts, and memory limits that restart one worker instead of taking the server down.
Managed services took a lot of work off our plate and I'd use them again. But they made it easy to forget that the code we write is still the part that can take everything down. That line didn't change for years. The data did.
That's all for now. If you're interested in more advanced content about WSGI, Apache, or other DevOps topics, there are many articles in the DevOps series that you might find interesting.
Mostafa-DE Fayyad
Software Engineer
Comments
Join the discussionThe list(rows) before paginate is the real trap: pagination only trims what goes out, the whole result set still lands in memory, and the cache keeps a copy. Pushing the page into the query (LIMIT plus a keyset on the order id) and caching per page keeps that line flat. Did you also cap the size of a cached value in Redis, or only fix the query?
The reminder that a managed database and a cache do not protect you from loading every row into memory is the part that stays useful. Calling list() on a lazy query result looks harmless in review, especially when the goal is to cache the next page, and it can still be enough to take a server down. Checking that a report query has a date limit, and that the cache is not holding the whole result just to return the first page, seems like a useful review habit. Matching the OOM-killed process to the long-running request is also a clear way to tell that story.
Good reminder that a managed service only protects the infrastructure layer, not how your code uses it. A per-request memory cap, pagination or streaming for large result sets, and an alert on memory per process (not just per host) usually catch this kind of bug before it takes the whole server down. Thanks for walking through the incident.